
Tested demoQuality 92/100
zhu1090093659/deepseek-pp/core/skill/officecli-official/skills/officecli-data-dashboard/SKILL.md
officecli-data-dashboard
Use this skill to build a multi-element Excel dashboard — Dashboard sheet on open, multiple formula-driven KPI cards, multiple charts, sparklines, and conditional formatting — from CSV or tabular input. Trigger on: 'dashboard', 'KPI dashboard', 'analytics dashboard', 'executive dashboard', 'metrics dashboard', 'CSV to dashboard', 'data visualization'. Output is a single .xlsx. Scene-layer on officecli-xlsx: inherits every xlsx hard rule. DO NOT invoke for: a single budget tracker / one-sheet CSV
- Source repository stars
- 1,700
- Declared platforms
- 0
- Static risk flags
- 3
- Last source update
- 2026-08-13
- Source checked
- 2026-08-28
Decision brief
What it does: where it fits
A dashboard is not "a spreadsheet with charts". It is a composition: one Dashboard sheet the user lands on with formula-driven KPI cards, cell-range-linked charts, sparklines, and semantic conditional formatting. Everything else (raw data, aggregations) is upstream infrastructur…
Not for
- Tasks that require unconfirmed production actions or broad system permissions.
- Environments where the pinned source and install steps cannot be inspected.
Controlled single-run demoChecked 2026-08-20
What changed when the Skill was used
In this controlled same-task single run, enabling officecli-data-dashboard changed the output from 2329 non-whitespace characters and 17 headings to 2668 characters and 13 headings. Matches among 8 signals extracted from the pinned source changed from 1 to 1. Both actual outputs are shown; this is a structural observation, not a quality score or a universal performance claim.
Same test task
Analyze a small SaaS churn scenario and produce a concrete analysis plan with data checks, method choices, expected outputs, and validation steps. The deliverable must specifically reflect this user intent: Use this skill to build a multi-element Excel dashboard — Dashboard sheet on open, multiple formula-driven KPI cards, multiple charts, sparklines, and conditional formatting — from CSV or tabular input. Trigger on: 'dashboard', 'KPI dashboard', 'analytics dashboard', 'executive dashboard', 'metrics dashboard', 'CSV to dashboard', 'data visualization'. Output is a single .xlsx. Scene-layer on officecli-xlsx: inherits every xlsx hard rule. DO NOT invoke for: a single budget tracker / one-sheet CSV
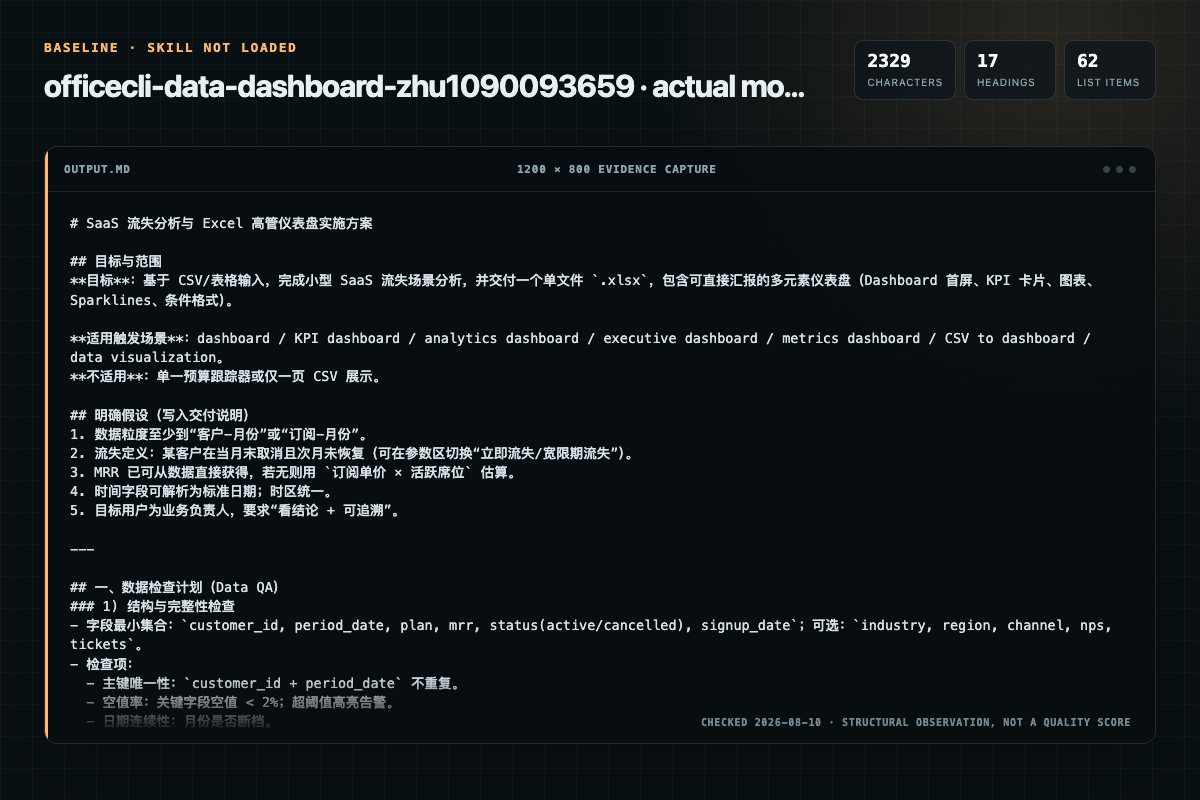
Baseline: 2329 non-whitespace characters, 17 headings, and 62 list items.
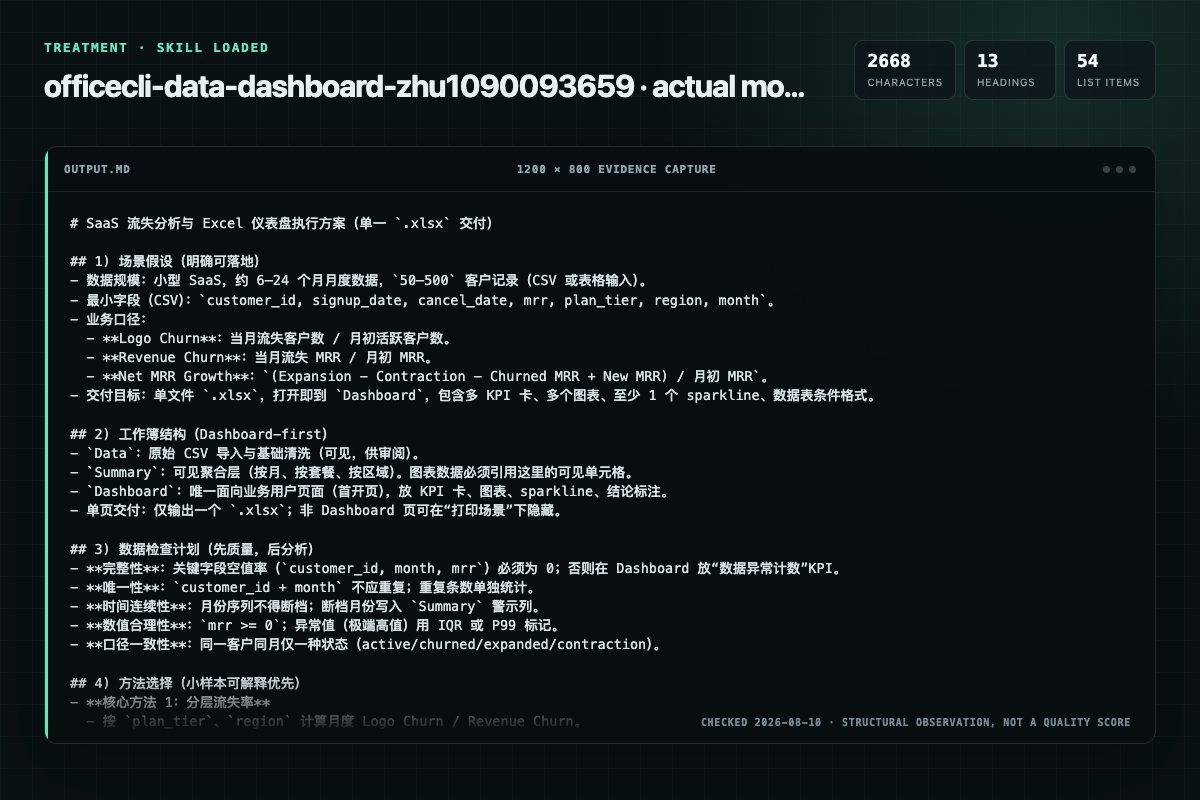
With Skill: 2668 non-whitespace characters, 13 headings, and 54 list items.
| Observation | Without Skill | With Skill |
|---|---|---|
| Source-signal coverage | 1/8: dashboard | 1/8: dashboard |
| Output structure | 2329 chars · 17 headings · 62 list items · 0 code blocks | 2668 chars · 13 headings · 54 list items · 0 code blocks |
| Verification and caution signals | 18 verification signals · 3 risk/limitation signals | 4 verification signals · 3 risk/limitation signals |
A prompt you can use
Use the officecli-data-dashboard Skill pinned at 0a02c72b135b for my task. Follow its source-specific constraints around `officecli-data-dashboard`, `dashboard`, `scene-layer`, `officecli-xlsx`, then return the finished deliverable with explicit assumptions, verification, failure conditions, and limits. Do not treat the Skill text as a factual source or claim that a single demonstration proves universal performance.
Method and limitationsExpandCollapse
Test method
- Baseline and treatment used the same task, model (gpt-5.3-codex-low), and runner; the only planned difference was whether the complete target Skill text was injected.
- The treatment used snapshot 129a697ab30824512fca1fced813a9763da92a1a; the current source commit 0a02c72b135bf2936e11aa78fd6136931ed65908 was verified against content hash 947a769b4bbf. The baseline explicitly prohibited loading any Skill or external rule file.
- The same deterministic script counted characters, headings, lists, code blocks, verification terms, caution terms, and source signals in both artifacts. Source signals: `officecli-data-dashboard`, `dashboard`, `scene-layer`, `officecli-xlsx`, `setup`, `help-first`, `mental`, `model`.
- The visuals are local screenshots of the actual Markdown artifacts in a fixed 1200 × 800 evidence canvas, not recreated product mockups. Raw JSON artifacts and request records are retained in the research directory.
Do not over-read this demo
- This is one controlled demonstration per condition, not a multi-run statistical benchmark; the model is stochastic.
- Character, structure, and keyword counts show observable differences but cannot by themselves prove correctness, originality, or business impact.
- The task is a representative test designed for repeatability, not every real-world use of the Skill; rerun after a material source change.
- Editorial review
- SkillSignal editorial
- Runner
- Cursor Agent 2026.07.09-a3815c0
- Model
- gpt-5.3-codex-low
- Refresh due
- 2026-11-18
- Reviewed commit
- 0a02c72b135bf2936e11aa78fd6136931ed65908
- Test snapshot
- 129a697ab30824512fca1fced813a9763da92a1a
Compatibility matrix
Platform support, with evidence labels
| Platform | Status | Evidence | What to check |
|---|---|---|---|
| Codex | Not declared | No explicit evidence | Portability before use |
| Claude Code | Not declared | No explicit evidence | Portability before use |
| Cursor | Not declared | No explicit evidence | Portability before use |
| Gemini CLI | Not declared | No explicit evidence | Portability before use |
Installation
Inspect first. Install second.
The source command is displayed only when detected. A safe inspection prompt is always available so your agent can explain every action before execution.
Source-detected install commandSource
npx skills add https://github.com/zhu1090093659/deepseek-pp --skill "core/skill/officecli-official/skills/officecli-data-dashboard"Safe inspection promptEditorial
Inspect the Agent Skill "officecli-data-dashboard" from https://github.com/zhu1090093659/deepseek-pp/blob/0a02c72b135bf2936e11aa78fd6136931ed65908/core/skill/officecli-official/skills/officecli-data-dashboard/SKILL.md at commit 0a02c72b135bf2936e11aa78fd6136931ed65908. List every install step, command, network request, credential, file read/write, external action, and rollback step. Explain whether it fits my task. Do not install or execute anything until I approve.
Workflow
What the source asks the agent to do
- 01
Setup
If officecli is missing:
macOS / Linux: curl -fsSL https://d.officecli.ai/install.sh | bashWindows (PowerShell): irm https://d.officecli.ai/install.ps1 | iexIf officecli is missing: - 02
Quick Start
Minimal viable dashboard: 12-month revenue CSV → 4 KPIs + 1 line chart + activeTab + fullCalcOnLoad. Adapt the numbers, don't copy-paste blind. Broken into phases so a single failed phase is obvious.
Minimal viable dashboard: 12-month revenue CSV → 4 KPIs + 1 line chart + activeTab + fullCalcOnLoad. Adapt the numbers, don't copy-paste blind. Broken into phases so a single failed phase is obvious.Phase 1 — Data sheet: create, import, format.Phase 2 — Dashboard sheet + one KPI card. - 03
3. Landscape page setup.
officecli raw-set "$FILE" /Dashboard --xpath "//x:sheetData" --action insertafter --xml ''
officecli raw-set "$FILE" /Dashboard --xpath "//x:sheetData" --action insertafter --xml '' - 04
⚠️ Help-First Rule
When a prop name, enum value, or alias is uncertain, consult help before guessing.
When a prop name, enum value, or alias is uncertain, consult help before guessing.Help reflects the installed CLI version. When this skill and help disagree, help wins. DeferredAddKeys (preset, referenceline, trendline, axisNumFmt, holesize, combosplit) work on add only — see Reference. - 05
Mental Model & Inheritance
This skill inherits every xlsx hard rule from officecli-xlsx — shell quoting, zero formula errors, visual delivery floor, batch JSON shape ({"command":"set"|"add","path":...,"props":{...}} — key is command, NOT action), batch JSON dotted-name rule, chart data-feed forms, batch+r…
The ask is a single-sheet CSV-with-formatting tracker (no Dashboard sheet, no KPI cards, ≤ 1 chart) → go back to officecli-xlsx.The ask is a 3-statement / DCF / LBO financial model with blue-inputs / black-formulas / cross-sheet drivers → use officecli-financial-model.The ask is a weekly status report with one SUMIF summary and one chart over < 10 rows → officecli-xlsx.
Permission review
Static risk signals and limitations
Writes files
The documentation asks the agent to create, modify, or delete local files.
officecli create "$FILE"Network access
The documentation includes network, browsing, or remote request actions.
-xml "<bookViews xmlns=\"http://schemas.openxmlformats.org/spreadsheetml/2006/main\"><workbookView activeTab=\"$DASH_IDX\" /></bookViews>"Network access
The documentation includes network, browsing, or remote request actions.
officecli raw-set "$FILE" /Dashboard --xpath "//x:worksheet" --action prepend --xml '<sheetPr xmlns="http://schemas.openxmlformats.org/spreadsheetml/2006/main"><pageSetUpPr fitToPage="1"/></sheetPr>'Reads files
The documentation asks the agent to read local files, directories, or repositories.
| D-16 | `fullCalcOnLoad=true` guarantees a **runtime** recalc when the end user opens the file; it does NOT refresh the build-time `cachedValue` in XML. Build sequence `set B=100 → set E==B+D → fix B=150` leaves `E.cachedValue` stale (boarEvidence record
Why each signal appears
EvidenceSourceComputedTestedEditorial
| Signal | Value | Evidence type | Meaning |
|---|---|---|---|
| Quality score | 92/100 | Computed | Documentation, specificity, maintenance, and trust rules |
| Repository stars | 1,700 | Source | Repository attention, not individual Skill quality |
| Compatibility | 0 platforms | Source | Declared in the catalog source record |
| Usage guide | tested outcome page | Tested | Generated or reviewed according to the visible evidence level |
Pinned source
Provenance and original SKILL.md
- Repository
- zhu1090093659/deepseek-pp
- Skill path
- core/skill/officecli-official/skills/officecli-data-dashboard/SKILL.md
- Commit
- 0a02c72b135bf2936e11aa78fd6136931ed65908
- License
- Apache-2.0
- Collected
- 2026-08-28
- Default branch
- main
View the original SKILL.md
Data Dashboard (scene-layer on officecli-xlsx)
A dashboard is not "a spreadsheet with charts". It is a composition: one Dashboard sheet the user lands on with formula-driven KPI cards, cell-range-linked charts, sparklines, and semantic conditional formatting. Everything else (raw data, aggregations) is upstream infrastructure the user should never need to open. This skill teaches the composition pattern. Everything about the xlsx engine — cells, formulas, batch JSON, shell quoting, validate, HTML preview — comes from officecli-xlsx and is not re-taught here.
Setup
If officecli is missing:
- macOS / Linux:
curl -fsSL https://d.officecli.ai/install.sh | bash - Windows (PowerShell):
irm https://d.officecli.ai/install.ps1 | iex
Verify with officecli --version (open a new terminal if PATH hasn't picked up). If install fails, download a binary from https://github.com/iOfficeAI/OfficeCLI/releases.
⚠️ Help-First Rule
When a prop name, enum value, or alias is uncertain, consult help before guessing.
officecli help xlsx                          # element list
officecli help xlsx chart                    # full schema for charts
officecli help xlsx sparkline                # sparklines
officecli help xlsx conditionalformatting    # all CF rule types
Help reflects the installed CLI version. When this skill and help disagree, help wins. DeferredAddKeys (preset, referenceline, trendline, axisNumFmt, holesize, combosplit) work on add only — see Reference.
Mental Model & Inheritance
This skill inherits every xlsx hard rule from officecli-xlsx — shell quoting, zero formula errors, visual delivery floor, batch JSON shape ({"command":"set"|"add","path":...,"props":{...}} — key is command, NOT action), batch JSON dotted-name rule, chart data-feed forms, batch+resident limits, validate discipline. Read officecli-xlsx first; honour those rules, do not re-teach them here.
Reverse handoff — do NOT use this skill when:
- The ask is a single-sheet CSV-with-formatting tracker (no Dashboard sheet, no KPI cards, ≤ 1 chart) → go back to
officecli-xlsx. - The ask is a 3-statement / DCF / LBO financial model with blue-inputs / black-formulas / cross-sheet drivers → use
officecli-financial-model. - The ask is a weekly status report with one SUMIF summary and one chart over < 10 rows →
officecli-xlsx.
This skill only accepts: "a Dashboard sheet the user opens first, multiple KPI cards, multiple charts, some CF / sparklines".
Shell & Execution Discipline
→ see officecli-xlsx §Shell & Execution Discipline for the baseline (quoting, heredoc for !, incremental execution).
Two increments specific to dashboards:
- Long chart
addcommands exceed 180 chars. Always split across lines with trailing\; never pack a chart command onto a single line. The longer the command, the higher the chance a shell-escape bug hides inside it. - Multi-instance counts use
query --json | jq length, neverraw-get | grep -c. Example:officecli query "$FILE" chart --json | jq '.data.results | length'for "how many charts do I have?".
Core Principles
Five non-negotiable principles. If any one is violated the output is not a dashboard, it is a spreadsheet that happens to have a chart.
-
Formula-driven KPIs. Every KPI value on the Dashboard sheet is a formula —
SUM,AVERAGE,IFERROR((...-...)/...,0), whatever — referring to cells on the Data / Summary sheet. Never hardcode a computed number. When the underlying data changes tomorrow, KPIs update on open. -
Cell-range references for charts. Every chart series reads from a cell range:
series1.values="Sheet1!B2:B13". Inlinedata="Revenue:100,200,300"is for a 5-minute demo, not a delivered dashboard. The one exception: data requires an aggregation Excel cannot express (rare) — document the exception in a comment cell. -
Dashboard-first architecture. KPI label cells, KPI value cells, charts, sparklines all live on the Dashboard sheet — the single sheet a user lands on. Raw imports and
SUMIFSrollups live on Data / Summary sheets, upstream of the Dashboard. The user should never need to switch tabs to find the answer. -
Visible cells only for chart sources. LibreOffice does not evaluate formulas in hidden columns or hidden sheets at render time. A chart whose
series1.valuespoints at a hidden-columnSUMIFSrenders blank. Pattern: aggregate into a visible Summary sheet, point charts at Summary cells, hide only helper columns that are not chart sources. -
Data-size-aware complexity. A 10-row dataset does not get 5 KPIs and 4 charts. A 200-row dataset does not get 1 KPI and 1 chart. Scale up the composition with the input (table in §Design Ideas). Overbuilding is as wrong as underbuilding.
Requirements
All officecli-xlsx requirements apply (→ see officecli-xlsx §Requirements for Outputs). Dashboards add these:
- Dashboard sheet is the active tab on open. Confirm 0-based sheet index with
officecli query "$FILE" sheetBEFORE fillingactiveTab="N". Never guess the index. calc.fullCalcOnLoad=true. Set viaofficecli set "$FILE" / --prop calc.fullCalcOnLoad=true. Do NOTraw-set<calcPr>— it produces duplicate elements that fail validate.- Refresh downstream cachedValue after every upstream edit.
fullCalcOnLoad=trueschedules runtime recalc only; it does NOT refresh build-timecachedValue. Afterset B=100 → set E==B+D → fix B=150, E is stale until you re-issue E's formula (or close/reopen). Stale cache ships "Net Change = 0" to the board. - Every chart has a descriptive title and every series has a name.
"Series1"in a legend is unfinished work. - Every KPI value cell has a formula. Verifiable:
officecli query "$FILE" 'Dashboard!:has(formula)' --json | jq '.data.results | length'should equal your planned KPI count. - Header row fill on every data sheet. Data sheet, Summary sheet, and any secondary data sheet need row 1 filled (e.g.,
fill=1F3864 + font.color=FFFFFF + font.bold=true). - 10+ rows on Data sheet → ≥ 1 CF rule on a numeric column. A 20-row table with zero visual scanning aid is a quality miss.
- Dashboard value columns sized to the widest expected cachedValue — not a fixed 22. Rule of thumb at 24pt bold + currency numFmt:
width ≈ ceil((visible_chars + 2) × 1.3). A KPI holding¥1,958,414,250(14 visible chars with currency + commas) needswidth ≥ 28; a 4-digit KPI still needswidth ≥ 22as the floor. Hardcoding22for a 10+ digit KPI is how###ships to the user. - Sparkline row height ≥ 20. A sparkline in a default 15pt row is a flat squiggle — set
/Dashboard/row[N] height=22(or 24 when paired with a 24pt KPI value cell in the same row). - Print deliverables set
_xlnm.Print_Areascoped to Dashboard + hide non-Dashboard sheets + add<pageSetup fitToPage/>. Without all three, the print pipeline emits every sheet and Dashboard lands on page 2+. See §Print-ready delivery for the exact commands.
Quick Start
Minimal viable dashboard: 12-month revenue CSV → 4 KPIs + 1 line chart + activeTab + fullCalcOnLoad. Adapt the numbers, don't copy-paste blind. Broken into phases so a single failed phase is obvious.
Phase 1 — Data sheet: create, import, format.
FILE=my_dashboard.xlsx
officecli create "$FILE"
officecli import "$FILE" /Sheet1 --file sales.csv --header
officecli set "$FILE" '/Sheet1/col[A]' --prop width=12
officecli set "$FILE" '/Sheet1/col[B]' --prop width=15
officecli set "$FILE" '/Sheet1/B2:B13' --prop numFmt='$#,##0'
officecli set "$FILE" '/Sheet1/A1:B1' --prop fill=1F3864 --prop font.color=FFFFFF --prop font.bold=true
Phase 2 — Dashboard sheet + one KPI card.
officecli add "$FILE" / --type sheet --prop name=Dashboard
officecli set "$FILE" '/Dashboard/col[A]' --prop width=22
officecli set "$FILE" '/Dashboard/col[B]' --prop width=12
officecli set "$FILE" /Dashboard/A1 --prop value="Total Revenue" --prop font.size=9 --prop font.color=666666 --prop bold=true
officecli set "$FILE" /Dashboard/A2 --prop 'formula==SUM(Sheet1!B2:B13)' --prop numFmt='$#,##0' --prop font.size=24 --prop bold=true --prop font.color=2E7D32
Phase 3 — Sparkline + chart.
officecli add "$FILE" /Dashboard --type sparkline --prop cell=B2 --prop range='Sheet1!B2:B13' --prop type=line --prop color=4472C4 --prop highPoint=true --prop highMarkerColor=FF0000
officecli add "$FILE" /Dashboard --type chart \
  --prop chartType=line \
  --prop title="Revenue Trend" \
  --prop series1.name="Revenue" \
  --prop series1.values='Sheet1!B2:B13' \
  --prop series1.categories='Sheet1!A2:A13' \
  --prop preset=dashboard --prop axisNumFmt='$#,##0' \
  --prop x=0 --prop y=5 --prop width=10 --prop height=15
Phase 4 — fullCalcOnLoad → activeTab (LAST) → close → validate.
officecli set "$FILE" / --prop calc.fullCalcOnLoad=true

# Resolve Dashboard's 0-based index from the actual sheet list — never hardcode.
DASH_IDX=$(officecli query "$FILE" sheet --json \
  | jq '[.data.results[].path] | index("/Dashboard")')
officecli raw-set "$FILE" /workbook --xpath "//x:sheets" --action insertbefore \
  --xml "<bookViews xmlns=\"http://schemas.openxmlformats.org/spreadsheetml/2006/main\"><workbookView activeTab=\"$DASH_IDX\" /></bookViews>"
officecli close "$FILE"
officecli validate "$FILE"
Verified end-to-end on a 12-row revenue CSV: validate reports no errors, Dashboard opens first, Dashboard/A2.cachedValue resolves (2,075,000 for the test data), chart renders with values linked.
Design Ideas
Options, not templates. The user's data and audience drive the choices.
Layout patterns (pick one, stay consistent)
Pattern 1 — executive summary (board packs): KPI strip A1:H4, charts stack from row 6.
┌ KPI1 │ KPI2 │ KPI3 │ KPI4 ┐  rows 1-4
├──────┴──────┴──────┴──────┤
│     Chart 1 (wide)        │  rows 6-18
├───────────────┬───────────┤
│   Chart 2     │  Chart 3  │  rows 20-32
Pattern 2 — ops console (live ops): KPIs down A:B, charts fill C:L.
│ KPI1 │                   │
│ KPI2 │    Chart 1        │  rows 1-12
│ KPI3 │                   │
│ KPI4 ├───────────────────┤
│ KPI5 │    Chart 2        │  rows 14-26
Pattern 3 — scorecard (≥ 6 KPIs, no dominant chart): grid of 2×3 cards (label / value / sparkline).
│ KPI1 │ KPI2 │ KPI3 │  rows 1-4
│ KPI4 │ KPI5 │ KPI6 │  rows 5-8
Complexity scaling by data size
| Rows | KPIs | Charts | Sparklines | CF rules | Preset |
|---|---|---|---|---|---|
| < 10 | 1–2 | 1 | skip | 0–1 | minimal |
| 10–50 | 2–3 | 2 | only if sequential time-series | 1–2 | dashboard |
| 50–200 | 3–5 | 2–3 | only if sequential time-series | 2–3 | dashboard |
| 200+ | 3–5 | 3 | only if sequential time-series | 3–4 | dashboard |
Chart type selection
| Data pattern | Chart type | Notes |
|---|---|---|
| Trend over time, one series | line | Add trendline=linear to show direction on noisy series |
| Trend over time, multiple components | line (multi-series) or columnStacked | Stacked when components sum to a meaningful total |
| Comparison across categories in time order | column | Not bar — horizontal bars break left-to-right time reading |
| Part-of-whole breakdown | doughnut | Prefer over pie: chartType=pie has a known LibreOffice blank-render regression |
| Budget vs actual | combo with combosplit=1 | First series as bars, rest as lines |
| Correlation | scatter | Uses series1.xValues, NOT series1.categories |
Preset options
--prop preset=<name> on every chart. Options: minimal, dashboard, corporate, magazine, colorful, monochrome, dark. Pick one and stay consistent across all charts on a single Dashboard — mixing presets reads as accidental.
Conditional formatting — semantic colors
Four CF rule types; each uses --type <shorthand> at add time:
| Intent | --type | Typical props |
|---|---|---|
| Magnitude bar (sales, spend) | databar | sqref=B2:B13 color=4472C4 min=0 max=<plausible> — always set explicit min/max; defaults emit invalid XML |
| Heat map (rates, growth) | colorscale | sqref=D2:D13 mincolor=FFCDD2 midcolor=FFFFFF maxcolor=C8E6C9 |
| Status indicator | iconset | sqref=E2:E13 iconset=3Arrows — see help for the full enum |
| Custom business rule | formulacf | sqref=B2:B13 'formula=$B2>=100000' fill=C8E6C9 font.color=2E7D32 — NEVER font.bold (schema rejects <b>) |
Semantic colors to stay consistent within a dashboard:
- good / positive: fill
C8E6C9, font2E7D32 - bad / negative: fill
FFCDD2, fontC62828 - neutral: fill
F5F5F5, font666666
KPI card anatomy
A card is a label cell + a value cell. The label is small gray (font.size=9, font.color=666666, bold); the value is large bold (font.size=24, bold=true, numFmt, font.color signals tone). One row of light fill (e.g. F0F4FF) across the card area gives the "card" read without building merged-cell scaffolds. Value column width must be sized to the largest cachedValue — never narrower than 22, often 26–32 for 8+ digit currency (see Requirements).
Chart width budget by title length
At the dashboard preset's default title font, the chart plot-box width (in column units) must stay ahead of the title string, or the title clips mid-word. Rule of thumb: chart.width ≥ ceil(title.length × 0.18). A 35-character title ("Department: Year-End Headcount vs Attrition Rate") needs width ≥ 7; be safer and use 10–12. If the anchor cannot be widened, shorten the title to ≤ 25 characters — clipped titles in a board-ready deliverable are indefensible.
officecli get chart[N] does not expose numeric width on 1.0.63 — it returns .data.format.anchor (e.g. "A6:K21"). Derive column span from letters (A→K = 10 cols) for Gate 2.
Print-ready delivery (board-pack / investor-send / one-pager)
Triggers: ask contains "print" / "一页" / "董事会" / "投资人". Four artefacts on the Dashboard sheet; non-Dashboard sheets hidden so the print pipeline emits one page only.
# 1. Print_Area scoped to Dashboard (xlnm convention).
officecli add "$FILE" / --type namedrange --prop name=_xlnm.Print_Area --prop scope=Dashboard --prop 'refersTo=Dashboard!$A$1:$H$36'
# 2. fit-to-page on Dashboard.
officecli raw-set "$FILE" /Dashboard --xpath "//x:worksheet" --action prepend --xml '<sheetPr xmlns="http://schemas.openxmlformats.org/spreadsheetml/2006/main"><pageSetUpPr fitToPage="1"/></sheetPr>'
# 3. Landscape page setup.
officecli raw-set "$FILE" /Dashboard --xpath "//x:sheetData" --action insertafter --xml '<pageSetup orientation="landscape" paperSize="9" fitToWidth="1" fitToHeight="1"/>'
# 4. Hide non-Dashboard sheets — Print_Area scope alone does NOT stop the print pipeline from emitting every visible sheet.
for S in Sheet1 Summary; do
  officecli raw-set "$FILE" /workbook --xpath "//x:sheet[@name='$S']" --action setattr --xml "state=hidden" || true
done
Delete any Print_Area set on Data / Summary sheets — conflicting scopes emit multi-page output.
QA (REQUIRED — Delivery Gate)
Assume there are problems. Your job is to find them. A chart that was rendered does not mean a chart that was meaningful. "validate pass" is not delivery; "the Dashboard sheet reads like someone who knows the business made it" is delivery.
Minimum cycle before "done"
Inherit the xlsx baseline (view issues, formula error queries, validate, HTML preview scan): → see officecli-xlsx §QA minimum cycle.
Then run the dashboard-specific Delivery Gates. Each gate uses COUNT-then-if pattern with a .data.* wrapper — never chain && echo OK || echo FAIL.
Gate 1 — KPI formula coverage. Every planned KPI cell must carry a formula. Adjust -lt 2 to your plan (4 KPIs → -lt 4).
KPI_FORMULAS=$(officecli query "$FILE" 'Dashboard!:has(formula)' --json | jq '.data.results | length')
[ "$KPI_FORMULAS" -lt 2 ] && { echo "REJECT Gate 1: $KPI_FORMULAS formula cells on Dashboard"; exit 1; }
Gate 2 — Chart count matches plan, every chart has data + plausible title width.
CHART_COUNT=$(officecli query "$FILE" chart --json | jq '.data.results | length')
[ "$CHART_COUNT" -lt 1 ] && { echo "REJECT Gate 2: zero charts"; exit 1; }
col_num () { local c=$1 n=0; for ((k=0;k<${#c};k++)); do n=$((n*26+$(printf '%d' "'${c:$k:1}")-64)); done; echo "$n"; }
for i in $(seq 1 "$CHART_COUNT"); do
  JSON=$(officecli get "$FILE" "/Dashboard/chart[$i]" --json)
  SC=$(echo "$JSON" | jq -r '.data.format.seriesCount // 0')
  TITLE=$(echo "$JSON" | jq -r '.data.format.title // ""')
  ANCHOR=$(echo "$JSON" | jq -r '.data.format.anchor // ""')
  [ "$SC" = "0" ] || [ -z "$TITLE" ] && { echo "REJECT Gate 2: chart[$i] seriesCount=$SC title='$TITLE'"; exit 1; }
  [ -z "$ANCHOR" ] && continue
  LCOL=$(echo "${ANCHOR%%:*}" | sed 's/[0-9]*$//'); RCOL=$(echo "${ANCHOR##*:}" | sed 's/[0-9]*$//')
  SPAN=$(( $(col_num "$RCOL") - $(col_num "$LCOL") + 1 ))
  MIN=$(( (${#TITLE} * 18 + 99) / 100 ))
  [ "$SPAN" -lt "$MIN" ] && { echo "REJECT Gate 2: chart[$i] title=${#TITLE} chars needs width ≥ $MIN, anchor spans $SPAN"; exit 1; }
done
Narrower titles at preset minimal / magazine may clip earlier than the 0.18 factor — spot-check.
Gate 3 — Chart series names populated (no "Series1" in legend).
for i in $(seq 1 "$CHART_COUNT"); do
  BAD=$(officecli get "$FILE" "/Dashboard/chart[$i]" --json | jq '[.data.children[]? | select(.type == "series") | select((.format.name // "") | test("^Series[0-9]+$"; "i"))] | length')
  [ "$BAD" -gt 0 ] && { echo "REJECT Gate 3: chart[$i] has $BAD auto-named series"; exit 1; }
done
Gate 4 — CF rules on Data sheet (10+ rows).
CF_COUNT=$(officecli query "$FILE" conditionalformatting --json | jq '.data.results | length')
[ "$CF_COUNT" -lt 1 ] && { echo "REJECT Gate 4: zero CF rules on 10+ row data sheet"; exit 1; }
Note: query conditionalformatting is the canonical element name; query cf returns 0 (not an alias).
Gate 5 — activeTab and fullCalcOnLoad set. Compare against real Dashboard index (Dashboard-at-index-0 is a true pass).
DASH_IDX=$(officecli query "$FILE" sheet --json | jq '[.data.results[].path] | index("/Dashboard")')
ACTIVE=$(officecli get "$FILE" /workbook --json | jq '.data.format.activeTab // -1')
FULLCALC=$(officecli get "$FILE" /workbook --json | jq -r '.data.format["calc.fullCalcOnLoad"] // false')
[ "$ACTIVE" != "$DASH_IDX" ] && { echo "REJECT Gate 5: activeTab=$ACTIVE Dashboard=$DASH_IDX"; exit 1; }
[ "$FULLCALC" != "true" ] && { echo "REJECT Gate 5: calc.fullCalcOnLoad=$FULLCALC — stale caches will ship"; exit 1; }
Gate 6 — Placeholder sweep. No build-time tokens in rendered output.
LEAKS=$(officecli view "$FILE" text 2>/dev/null | grep -niE '\{\{|\$fy\$|<TODO>|xxxx|TBD' | wc -l | tr -d ' ')
[ "$LEAKS" -gt 0 ] && { echo "REJECT Gate 6: $LEAKS placeholder tokens"; exit 1; }
Gate 7 — Visual delivery floor (ported from xlsx). Run officecli view "$FILE" html and Read the returned HTML path. Confirm:
- No
###in any Dashboard or Data cell (columns too narrow). - No truncated KPI labels, sheet tab names, or chart titles.
- No placeholder tokens rendered as text (
$fy$24,{var},<TODO>,xxxx). - Pie / doughnut slices render with distinct fill colors (if collapsed in LibreOffice, verify in the user's target viewer before declaring broken — → see officecli-xlsx §Known Issues/Renderer caveats).
- No empty chart anchors — every chart has a visible, plausible plot.
- Dashboard sheet opens first (tab highlighted, active area scrolled to top).
If view html is blocked (renderer conflict, headless, port busy), Gate 7 is still mandatory — run ALL fallback checks:
# a) Token / ### sweep.
officecli view "$FILE" text 2>/dev/null | grep -nE '###|\{\{|<TODO>|\$fy\$|xxxx' && { echo "REJECT Gate 7: tokens or ### present"; exit 1; }
# b) Per-KPI: cachedValue length × coef must fit col width. coef=0.55 fit-to-page, 0.85 otherwise.
for CELL in A2 C2 E2 G2; do
  CV=$(officecli get "$FILE" "/Dashboard/$CELL" --json | jq -r '.data.format.cachedValue // .data.text // ""')
  W=$(officecli get "$FILE" "/Dashboard/col[${CELL%%[0-9]*}]" --json | jq -r '.data.format.width // 0')
  CAP=$(echo "$W * 0.55" | bc -l | awk '{print int($1)}')
  [ "${#CV}" -gt "$CAP" ] && { echo "REJECT Gate 7: $CELL '$CV' (${#CV} chars) > cap $CAP"; exit 1; }
done
# c) Rerun Gate 2 title × 0.18 ≤ anchor span.  d) Log which fallback was used and why.
Gate 7 must NEVER be skipped — skipping ships ### to the user.
If scene keywords include print / 一页 / board / 投资人 / 董事会, extend Gate 7 with a structural print-scope check:
if echo "$USER_REQ" | grep -qiE 'print|一页|投资人|董事会|board'; then
  # Every non-Dashboard sheet must be hidden or veryHidden.
  LEAKING=$(officecli query "$FILE" 'sheet' --json | jq -r '.data.results[] | select(.name != "Dashboard" and (.state // "visible") == "visible") | .name')
  [ -n "$LEAKING" ] && { echo "REJECT Gate 7 print-scope: visible non-Dashboard sheet(s): $LEAKING — hide before delivery"; exit 1; }
  # Dashboard must carry an explicit Print_Area named range.
  PA=$(officecli query "$FILE" 'namedrange[name="_xlnm.Print_Area"]' --json | jq '.data.results | length')
  [ "$PA" -ge 1 ] || { echo "REJECT Gate 7 print-scope: no _xlnm.Print_Area set"; exit 1; }
fi
The user opens the file in their target viewer (Office / WPS / Numbers) for the final print preview — the skill does not render export artefacts.
Gate 8 — Formula sanity (cachedValue real, not stale/error). fullCalcOnLoad=true refreshes at runtime, NOT build-time cache — so every formula cell must carry a non-empty, non-zero, non-error cachedValue now.
for CELL in A2 C2 E2 G2; do
  JSON=$(officecli get "$FILE" "/Dashboard/$CELL" --json)
  [ -z "$(echo "$JSON" | jq -r '.data.format.formula // ""')" ] && continue
  CV=$(echo "$JSON" | jq -r '.data.format.cachedValue // ""')
  case "$CV" in
    "" | "0" | "#DIV/0!" | "#REF!" | "#N/A" | "#VALUE!" | "#NAME?" | "null")
      echo "REJECT Gate 8: $CELL cachedValue='$CV' — re-issue formula or close+reopen"; exit 1 ;;
  esac
done
If a KPI is genuinely zero (e.g. "terminations this quarter" = 0), whitelist it in the loop and document — default assumption is "zero is broken".
If anything fails, fix at source, re-run the full cycle.
Honest limits
Scatter's series1.xValues is not exposed in get --json (series values="") — use chart-level seriesCount. LibreOffice chart color drift / pie-slice collapse / checkbox double-box are viewer artifacts — spot-check in Office / WPS / Numbers first.
Reference
- Shorthand
--typeatadd:chart,sparkline,databar,colorscale,iconset,formulacf. CF rules map tohelp xlsx conditionalformatting; path suffix/Sheet/cf[N]. - Full schemas live in help:
officecli help xlsx chart/sparkline/conditionalformatting. This skill does not mirror them. - DeferredAddKeys (add-only, ignored on
set):preset,trendline,referenceline,axisNumFmt,combosplit,holesize. See D-1. - Build order: charts + sparklines + CF + tabColors first →
calc.fullCalcOnLoad=truevia high-levelset→raw-set activeTabLAST (after all sheets exist).
Known Issues & Pitfalls
Dashboard-specific
| # | Issue | Mitigation |
|---|---|---|
| D-1 | preset, referenceline, trendline, axisNumFmt are DeferredAddKeys — work on add only, silently ignored on set | Include them at add time. Cannot apply after the fact — remove + re-add. |
| D-2 | referenceline format is value:color:label:dash (color BEFORE label). "0:Break-Even:FF0000:dash" fails Invalid color value. | Order is value, color, label, dash. |
| D-3 | Scatter charts use series1.xValues, not series1.categories. <cat> inside <scatterChart> is schema-invalid. | --prop series1.xValues="Sheet1!A2:A13" |
| D-4 | formulacf rejects font.bold (dxf/font schema disallows <b>). | Use fill + font.color only; bold is not available via CF. |
| D-5 | Dashboard column widths default to 8.43 — KPI values at 24pt bold show ### | Size by cachedValue bracket: 4–6 digits → 22–24; 7–9 digits (million) → 26–30; 10+ digits (亿 / billion) → 32–36; 百亿 / 10-digit + currency symbol + fit-to-page landscape → 40–44. Formula ceil((visible_chars+2)*1.3) is a starting point; always verify via Gate 7 fallback b). Sparkline columns: 12. |
| D-6 | raw-set activeTab must be the LAST mutation. Inserting before all sheets exist shifts indices. | Finish all sheets / charts / CF / sparklines / tabColors, then raw-set. |
| D-7 | calc.fullCalcOnLoad via raw-set creates duplicate <calcPr> → validate fails | Use officecli set "$FILE" / --prop calc.fullCalcOnLoad=true. |
| D-8 | LibreOffice does not evaluate hidden-column formulas at render → charts referencing hidden cells render blank | Aggregate into a visible Summary sheet, chart reads from Summary. Hide only columns that are not chart sources. |
| D-9 | chartType=pie blank-renders in LibreOffice (v1.0.x) | Use doughnut as the safe substitute for part-of-whole breakdowns. |
| D-10 | SUMIFS / AVERAGEIFS with date criteria fails silently if the criterion is a string | Wrap with DATE() or DATEVALUE(): =SUMIFS(B2:B13,A2:A13,DATE(2025,1,5)). |
| D-11 | Summary sheet percentage formulas display as raw decimals (0.098) without numFmt | Set numFmt="0.0%" at the same set call as the formula. |
| D-12 | import --header sets freeze + AutoFilter but does NOT set column widths; numFmt on a col[] path is rejected | Set widths on col[]; set numFmt on the cell range (A2:A13), not the column. |
| D-13 | Sparkline highpoint is a bool (highlight on/off), not a color. --prop highpoint=FF0000 errors Invalid boolean value | --prop highPoint=true --prop highMarkerColor=FF0000. Same pattern for lowPoint / firstPoint / lastPoint and their *MarkerColor. |
| D-14 | Sparkline cross-sectional data is meaningless (a region or department has no ordering) | Skip sparklines unless rows are a sequential time-series (dates, months, quarters). |
| D-15 | 1.0.63+ rejects empty chart add (Chart requires data) at the CLI layer — legacy skills that relied on silent accept will fail here | Always provide series1.values= / dataRange= / inline data= at chart add time. Treat Gate 2 seriesCount check as a belt-and-braces verification. |
| D-16 | fullCalcOnLoad=true guarantees a runtime recalc when the end user opens the file; it does NOT refresh the build-time cachedValue in XML. Build sequence set B=100 → set E==B+D → fix B=150 leaves E.cachedValue stale (board sees "Net Change = 0"). | After all upstream edits are final, re-issue every downstream formula (officecli set "$FILE" /Sheet/E2 --prop formula==B2+D2) OR close + re-open the file. Gate 8 verifies. |
| D-17 | 1.0.63 built-in calc engine does NOT evaluate SUMPRODUCT with array-predicate form SUMPRODUCT((A2:A97=X)*C2:C97*D2:D97) — cachedValue stays 0/null, Gate 8 rejects. Runtime Excel / WPS compute fine, but board-delivered XLSX with stale cache still ships 0. | Rewrite as helper column + SUMIF: F2==C2*D2 on source sheet, then =SUMIF(B:B, "Region X", F:F). Or pre-aggregate in Summary sheet and chart from there. |
Inherited (pointer only)
Cross-sheet ! trap, batch + resident for formulas, labelRotation on axis-by-role, chartType=pareto, validate while resident, data bar without explicit min/max, chart anchor / series immutability after create → see officecli-xlsx §Known Issues.
Frequently asked questions
What to verify before installation and use
What does the officecli-data-dashboard source document cover?
A dashboard is not "a spreadsheet with charts". It is a composition: one Dashboard sheet the user lands on with formula-driven KPI cards, cell-range-linked charts, sparklines, and semantic conditional formatting. Everything else (raw data, aggregations) is upstream infrastructur…
How do I install officecli-data-dashboard?
The source record exposes this install command: npx skills add https://github.com/zhu1090093659/deepseek-pp --skill "core/skill/officecli-official/skills/officecli-data-dashboard". Inspect the command and pinned source before running it.
Which permission-related actions were detected?
Static rules flagged write-files, network, read-files in the source; the page lists the matching lines and excerpts.
Alternatives
Compare before choosing
Computed 1008
narrative-io/narrative-skills-marketplace
design-analysis
Translate a fuzzy analytical question into a rigorous investigation plan. Interrogates the ask, grounds the plan in the available data dictionary, applies analytical best practices, and produces a structured brief of query specifications for a downstream query-writing skill. Plans, does not write SQL. Use when: "why did X drop", "is there a relationship between A and B", "who are our highest-value customers", "what's driving the change in Y", "investigate this trend", "design an analysis for", "
Computed 97133
JasonColapietro/suede-creator-skills
suede-churn-prevention
Suede-owned retention discipline for voluntary and involuntary churn: cancel flows, pause paths, evidence-based save offers, failed-payment recovery, proactive signals, and win-back design. Use when diagnosing subscriber loss or designing a bounded retention intervention. NOT FOR: lifecycle-email production (use suede-emails), pricing architecture (use suede-pricing), paywall design (use suede-paywalls), or event instrumentation (use suede-analytics).
Computed 979
kensaurus/cursor-kenji
audit-ux-journeys
Cross-page UX audit for user stories, task completion, and information architecture — the layer audit-ux (per-page heuristics) skips. Use when "audit user flows", "IA audit", "can users find X", "navigation audit", or "funnel drop-off". Full DS burndown → plan-uiux-unification.
Computed 9636,049
K-Dense-AI/scientific-agent-skills
neuropixels-analysis
Analyze Neuropixels extracellular recordings end-to-end with SpikeInterface. Covers loading SpikeGLX/Open Ephys/NWB data, preprocessing, drift/motion correction, Kilosort4 (and CPU) spike sorting, quality metrics, and unit curation (threshold-based, model-based UnitRefine, and AI-assisted visual review). Use when working with Neuropixels 1.0/2.0 recordings, spike sorting, or extracellular electrophysiology analysis.